

Good Data Visualisation Techniques turn numbers into something people can understand, compare and act on. A spreadsheet containing thousands of rows may hold important information, but those patterns can remain almost invisible until the data is organised and displayed appropriately.
That does not mean every dataset needs an elaborate interactive dashboard. Sometimes a carefully designed bar chart communicates the answer better than a complex visual interface. At other times, decision-makers genuinely need filters, multiple indicators and regularly updated data dashboards.
The skill lies in choosing the right method for the question, not in creating the most impressive-looking graphic.
Data visualisation also sits within the wider process of data analysis. Before deciding how a chart should look, you need to know whether the data is reliable, what comparison matters and what the audience is supposed to learn from it.
This guide explains the most useful visualisation techniques, common chart types, data visualisation best practices, popular tools and the skills that can support a Data visualisation career path in UK organisations.
What Is Data Visualisation?
Data visualisation means representing data through visual forms such as charts, graphs, maps and dashboards.
Its purpose is usually to make relationships, comparisons, patterns and changes easier to recognise than they would be in raw tables.
Imagine that a retailer has monthly sales figures for 20 branches covering three years.
A spreadsheet can tell you every individual number. A well-designed visualisation can make it much easier to see:
- whether total sales are rising or falling;
- which branches consistently perform differently;
- whether certain months show seasonal patterns;
- where unusual changes occurred.
Visualisation does not replace the underlying data. It provides a different way of understanding it.
It can be used in exploratory work, where analysts are searching for patterns, and in explanatory work, where the objective is to communicate a finding that has already been identified.
That distinction matters.
An analyst exploring data may need many filters, experimental plots and detailed views. An executive reading a report may need one chart that communicates the main conclusion within seconds.
Data Visualisation Starts With Data Analysis
A common beginner mistake is opening a visualisation tool before understanding the question. Effective visualisation should come after at least some data analysis, data interpretation and analytical thinking.
Suppose an organisation asks:
“Can you create a dashboard of our customer data?”
That sounds like a visualisation request, but it is not yet a useful analytical question.
A good analyst might first ask:
What decisions will the dashboard support?
Who will use it?
Which customer measures matter?
How frequently will the data change?
What does the organisation mean by an active customer?
Are the source systems reliable?
Without these answers, the analyst risks creating attractive charts that answer nobody’s real question.
A useful process is:
Question → data → analysis → insight → visualisation → decision
The visual is near the end of the data analysis process, not the beginning.
Choose the Chart Based on the Question
One of the most important Data Visualisation Techniques is simply matching the chart to the type of comparison you need to show. Different data visualisation methods make different relationships easy to see.
Bar Charts for Comparing Categories
Bar charts are excellent when the question is:
Which category is larger or smaller?
For example, you might compare:
- sales by region;
- complaints by department;
- applications by course;
- expenditure by category.
Bar length is relatively easy for people to compare accurately. Where category labels are long, horizontal bars can be particularly readable.
Ordering the bars deliberately can also improve interpretation. A ranked chart from highest to lowest may reveal the pattern more quickly than displaying categories alphabetically.
Avoid adding 3D effects, shadows and decorative textures. These rarely improve understanding and can distort perceived values.
Line Charts for Change Over Time
Line charts are generally appropriate for continuous or ordered trends, especially time. They are a common data visualisation technique for showing changes and patterns.
They can show:
- monthly revenue;
- annual population;
- website traffic;
- weekly demand;
- temperature over time.
A line encourages the eye to follow movement.
If you are comparing several series, however, restraint matters. A chart containing 17 overlapping lines may technically display everything while communicating almost nothing.
Consider whether all series genuinely need to appear together. Sometimes the clearest solution is to show selected comparisons or create several smaller charts.
Scatter Plots for Relationships
Scatter plots are useful when you want to explore the relationship between two numeric variables. This type of data visualisation can help identify patterns, clusters and possible correlations.
Examples might include:
- advertising spend and revenue;
- property size and price;
- age and blood pressure;
- delivery distance and delivery time.
Each point represents an observation.
The pattern may suggest that two variables are related, but visual association alone does not prove causation.
If sales rise as advertising expenditure increases, it does not automatically follow that advertising caused the entire increase. Seasonality, pricing, product changes and other factors may also matter.
Good visualisation supports interpretation without encouraging stronger conclusions than the Data Visualisation Techniques justify.
Pie Charts for Limited Part-to-Whole Comparisons
Pie charts can work when a small number of categories make up a meaningful whole. For example, a simple chart showing four sources of annual revenue may be understandable.
Problems arise when the chart contains many similar slices. People find angles harder to compare precisely than lengths, so a bar chart often works better when ranking is important.
A pie chart containing 15 categories and a large legend is rarely an improvement over a table or bar chart.
Use the format because it answers the question, not because it looks familiar.
Tables Are Sometimes the Better Visualisation
Data Visualisation Techniques does not mean replacing every table.
If users need exact values, a well-designed table can be superior to a chart.
Consider a finance manager checking departmental budgets. They may need the exact expenditure and remaining budget for every team. A bar chart can highlight which departments spend most, but a table may be more useful for operational decisions requiring exact numbers.
The strongest report may use both: a chart to communicate the pattern and a concise table for precise values.
Understanding the Most Important Comparison
Before creating any chart, ask:
What should the audience compare?
Suppose unemployment is 4.8%. On its own, that number provides limited context.
Should it be compared with:
- last month?
- last year?
- another region?
- the national average?
- a long-term trend?
The appropriate comparison depends on the question.
This is why chart design is not just a technical task. It requires analytical judgement and an understanding of the Data Visualisation Techniques.
A visually polished chart can still mislead if it encourages the wrong comparison.
Data Visualisation Best Practices
Strong data visualisation best practices are usually about removing obstacles between the reader and the information. Good chart design should make Data Visualisation Techniques easier to understand, compare and interpret.
Keep the chart focused
Every visual should have a reason to exist.
If you cannot explain the main purpose of a chart in one sentence, it may be trying to do too much.
Ask:
“What should someone understand after looking at this?”
The answer can guide decisions about chart type, annotation and Data Visualisation Techniques selection.
Use informative titles
“Sales by Month” tells the reader what variables are present.
“Online sales recovered in Q2 after a weak start to the year” tells the reader what the chart is actually showing.
Where appropriate, descriptive titles help readers understand the main finding quickly.
Not every chart should state a conclusion, particularly in exploratory dashboards, but explanatory reports often benefit from titles that communicate the important message.
Remove unnecessary clutter
Borders, shadows, background gradients, decorative icons, excessive gridlines and 3D effects can compete with the Data Visualisation Techniques.
Simpler does not mean boring. It means making intentional decisions about what deserves attention.
If an element does not help somebody interpret the chart, consider removing it.
Label clearly
Users should not have to guess what an axis measures.
Include units where necessary.
“Revenue” may be insufficient if the values could represent pounds, thousands of pounds or millions.
Dates also need enough context. A graph labelled simply Jan, Feb and Mar becomes ambiguous when multiple years are involved.
Use colour purposefully
Colour is useful for highlighting differences and directing attention, but more colour does not automatically create more information.
A dashboard where every chart uses a different rainbow palette becomes visually exhausting.
Use colour consistently. If red means “below target” in one chart, avoid using the same red simply as decoration somewhere else.
More importantly, do not rely exclusively on colour to communicate essential distinctions. Some users will have difficulty distinguishing particular colours, and visualisations may also be printed or viewed in less favourable conditions.
Labels, symbols or line styles can provide additional cues.
Use sensible axis scales
Axes can dramatically influence how differences appear.
For bar charts, starting the quantitative axis away from zero can exaggerate relatively small differences because the visual comparison depends on bar length.
Line charts require more judgement because a non-zero baseline can sometimes be appropriate, but the scale should never be chosen simply to make a trend look dramatic.
Always ask whether the visual impression is proportionate to the underlying numerical difference.
Show uncertainty when it matters
Not all numbers are equally certain.
Forecasts, survey estimates and models often contain uncertainty.
A chart that displays one forecast line as though the future were known precisely can create false confidence.
Depending on the context, confidence intervals, ranges, scenario bands or explanatory notes may be appropriate.
The audience should be able to distinguish observed information from estimates.
Accessibility Is Part of Good Data Visualisation

Accessibility should not be treated as something added after a dashboard has been designed.
Charts can create barriers for people with visual, cognitive or motor impairments.
Current government guidance recommends avoiding reliance on colour alone, using clear labels and providing essential information in alternative forms.
For public or widely distributed visualisations, that may involve:
- meaningful alternative text;
- supporting data tables;
- downloadable machine-readable data;
- readable text and sufficient contrast;
- layouts that work when zoomed;
- testing on smaller screens.
Interactive charts can be especially challenging for assistive technology.
If important values become visible only when a user hovers a mouse pointer over a tiny point, some people may struggle to access the information.
The key principle is straightforward:
The message should not disappear for users who cannot interact with the chart in the expected visual way.
What Are Data Dashboards?
Data dashboards combine several indicators or visualisations so users can monitor a subject in one place.
Examples include:
- an ecommerce performance dashboard;
- a hospital-capacity dashboard;
- a sales dashboard;
- an HR workforce dashboard;
- a financial performance dashboard.
A dashboard may contain headline metrics, charts, filters and tables.
It can also update automatically as new Data Visualisation Techniques arrives. That makes dashboards valuable for recurring decisions.
A sales manager, for example, might check a dashboard every morning to review pipeline value, closed sales, target achievement and overdue opportunities.
Not Every Problem Needs a Dashboard
Dashboards are fashionable, which can encourage organisations to build them even when a simpler report would work better.
Current ONS and Government Analysis Function guidance warns against this.
A dashboard makes most sense when the information changes frequently and users genuinely need to revisit and interact with it.
If an analysis answers one specific question once a year, a clear report containing two charts may be better.
Dashboards also create maintenance responsibilities.
Somebody needs to ensure:
- the data refreshes correctly;
- measures remain relevant;
- broken connections are repaired;
- definitions remain consistent;
- users understand the indicators.
An abandoned dashboard with outdated Data Visualisation Techniques can be more dangerous than having no dashboard at all because it creates an appearance of current information.
How to Design an Effective Dashboard
Good dashboard design starts with users rather than software.
Identify the decisions
Ask what somebody should be able to decide after viewing the dashboard.
A senior executive and an operational team leader may need different levels of detail.
Trying to satisfy everybody with one page can create a crowded interface that works for nobody.
Prioritise information
The most important information should receive the most visual attention.
A key performance indicator should not compete with 20 equally prominent graphics.
Arrange the page so users encounter the most consequential information first.
Give context
A number such as:
Customer retention: 87%
is much more useful if the reader can also see:
- previous period;
- target;
- trend;
- relevant comparison.
Context turns a metric into useful information.
Limit unnecessary interaction
Filters and drill-down features can be useful, but interaction should solve a real user need.
A dashboard does not become more sophisticated simply because everything can be clicked.
Every additional control creates another thing the user must understand.
Best Data Visualisation Tools
There is no universal answer to the question of the best data visualisation tools.
The appropriate choice depends on the organisation, audience, data scale, technical skills and output.
Several tools are particularly common.
| Tool | Useful for | Typical strength |
| Excel | Everyday analysis and charts | Familiar, flexible and widely available |
| Power BI | Business intelligence and interactive reporting | Data modelling, dashboards and organisational reporting |
| Tableau | Interactive analytics and visual exploration | Strong visual analysis and dashboard creation |
| Python | Reproducible and customised analysis | Automation, flexibility and large analytical ecosystem |
| R | Statistical analysis and reproducible graphics | Strong statistical and research workflows |
This is not a ranking.
A sophisticated tool used badly produces a bad visualisation. A simple Excel chart created by someone who understands the question can be far more useful.
Excel for Data Visualisation
Excel is sometimes dismissed because newer business-intelligence platforms appear more advanced.
That overlooks how useful it remains.
For straightforward business data, Excel can create line, bar, scatter and other charts quickly and can combine PivotTables with PivotCharts for interactive analysis.
It is particularly practical when Data Visualisation Techniques already exists in spreadsheets and the audience expects an Excel-based workflow.
Its limitations become more apparent when organisations need highly automated reporting, complex data models or many users accessing centrally governed reports.
The tool should match the problem.
Power BI for Reports and Dashboards
Power BI is widely used for business intelligence.
It can connect data from different sources, model relationships and produce interactive reports. Visuals can cross-filter or highlight one another, allowing users to explore different parts of the data.
This makes it useful for recurring organisational reporting.
However, learning where to drag fields on a screen is only the beginning.
Professional Power BI work may require:
- data modelling;
- Power Query;
- DAX;
- data-quality understanding;
- access control;
- report design;
- stakeholder requirements.
A visually attractive Power BI page built on a badly designed model can produce misleading answers efficiently.
Tableau for Visual Analytics
Tableau is another established platform associated with interactive visual analysis and dashboards.
It can be valuable where analysts need to explore data visually and publish interactive views for other users.
As with Power BI, software knowledge alone is not enough.
Employers usually gain more value from analysts who understand data structure and business questions than from people who have memorised where every menu option is located.
Tools evolve.
Analytical principles travel with you.
Python and R
Programming becomes useful when visualisation forms part of a larger reproducible analytical workflow.
Python libraries can create anything from basic plots to highly interactive graphics. Plotly, for example, supports interactive charts, while other common Python libraries support statistical and publication-oriented work.
R is widely used in statistics, research and analytical environments and also has powerful visualisation capabilities.
Code-based visualisation has several advantages.
Processes can be automated, repeated on updated datasets and reviewed systematically.
The trade-off is a steeper technical learning curve than point-and-click tools.
For many analysts, the ideal toolkit eventually includes both: a business intelligence platform for organisational reporting and programming for more flexible analysis.
Data Visualization Tools Should Follow the Problem
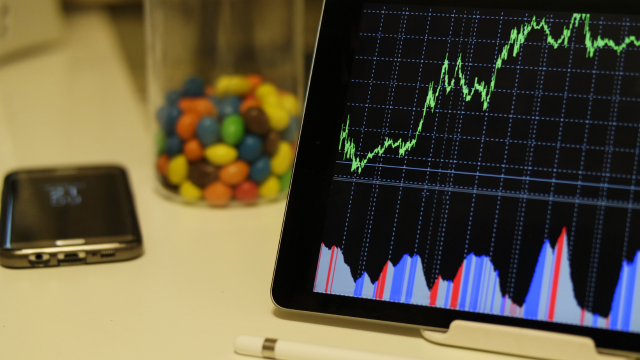
When comparing Data Visualisation Techniques tools, avoid beginning with:
“Which software should I learn?”
A better question is:
“What type of work do I want to do?”
Someone producing monthly finance charts may benefit immediately from deeper Excel skills.
A business analyst supporting interactive corporate reporting may prioritise Power BI.
A research analyst working with large statistical datasets might gain more from R or Python.
Tool selection becomes much easier after defining the intended career and workflow.
Essential Data Visualisation Skills
Professional Data Visualisation Techniques skills extend considerably beyond chart creation.
Data cleaning
Real-world datasets contain missing values, duplicates, inconsistent categories and incorrect formats.
If the underlying Data Visualisation Techniques is poor, the visual simply presents poor information more convincingly.
Analysts therefore need to understand how to inspect and clean data before presenting it.
Analytical reasoning
You need to recognise which comparison answers the question.
This requires understanding averages, proportions, distributions, trends and relationships.
You also need enough statistical judgement to avoid drawing conclusions that the evidence cannot support.
Chart selection
Knowing when to use a line rather than a bar chart sounds basic, but it has a large effect on clarity.
More advanced visualisation does not mean selecting more unusual chart types.
The simplest accurate chart is often the strongest.
Communication
A good analyst can explain what the visual means to somebody who did not create it.
That includes choosing clear titles, writing concise explanatory text and answering questions from non-technical stakeholders.
Business or domain knowledge
Data gains meaning from context.
A sudden drop in customer orders may look alarming until you learn that the company intentionally stopped selling one product line.
Analysts need to understand the environment surrounding the numbers.
Technical skills
Depending on the role, useful technical skills can include:
- Excel;
- SQL;
- Power BI or Tableau;
- Python or R;
- database concepts;
- data modelling.
Not every beginner needs all of them immediately.
Build competence progressively.
A Practical Data Visualisation Techniques Workflow
A repeatable workflow helps prevent decorative visualisation.
1. Define the question
Be specific about what needs to be understood.
“Analyse sales” is broad.
“Which product categories contributed most to the decline in UK sales during Q2?” is workable.
2. Identify and check the data
Determine where the information comes from and whether it is appropriate for the question.
Check missing values, definitions, date ranges and obvious errors.
3. Analyse before designing
Use calculations and exploratory charts to find what the data actually says.
Do not decide the story in advance and then search for a chart that appears to prove it.
4. Choose the comparison
Decide whether the audience needs to compare categories, time, distribution, relationship or composition.
That decision usually narrows the chart choices substantially.
5. Create the simplest useful visual
Build a first version.
Then remove unnecessary decoration and clarify labels.
6. Test with another person
A chart can seem obvious when you have spent hours with the dataset.
Show it to someone less familiar with the subject.
Ask what they think it means.
If their answer is completely different from yours, the visual needs work.
7. Provide context and limitations
Explain unusual definitions, missing data, uncertainty or other factors that affect interpretation.
Transparency strengthens rather than weakens analysis.
How Misleading Data Visualisation Techniques Happens
Not every misleading chart is created deliberately.
Many arise from poor design decisions.
Truncated axes
A bar chart beginning close to the smallest value can make minor differences appear enormous.
Inconsistent intervals
A time axis showing January, February, March and then December with identical spacing can create a false impression of continuous change.
Too many categories
Crowding a chart with excessive series can prevent meaningful comparison.
Dual axes
Charts with two different vertical scales can make unrelated movements appear strongly connected.
Dual-axis charts are not automatically wrong, but they require great care.
Selective time periods
Showing only the months supporting a desired story can conceal a very different longer-term trend.
Decorative area and volume
Three-dimensional charts can make objects with similar underlying values appear substantially different because viewers perceive area or volume rather than a clean length comparison.
The remedy is not a longer disclaimer.
Choose a more honest visual.
Learning Data Visualisation
Beginners often make rapid progress once they combine theory with repeated practice.
Start with a small dataset and ask several different questions of it.
Create a chart for each question.
Then explain why you chose that chart.
You can also study professionally published visualisations and ask:
What comparison is being emphasised?
Why was this chart selected?
What has been removed?
How is uncertainty shown?
Could somebody understand this without reading the full report?
Structured introductory learning can also help organise the fundamentals. A learner exploring the subject might use a course such as Data Visualisation Fundamentals alongside practical exercises and authoritative guidance from organisations such as the ONS.
Before enrolling in any private course, check the syllabus, learning outcomes, assessment, structured learning time and any claims concerning accreditation or professional recognition.
A completion certificate can demonstrate that study took place, but it should not automatically be treated as a regulated Data Visualisation Techniques qualification or proof of occupational competence.
Building a Data Visualisation Portfolio
A portfolio can be particularly valuable for people trying to enter data careers.
Avoid filling it with disconnected charts simply to demonstrate that you know many formats.
A stronger project explains:
The question: What were you trying to discover?
The data: Where did it come from?
The analysis: What cleaning or calculation was needed?
The visual decision: Why did you choose this format?
The insight: What should the reader learn?
The limitation: What can the data not establish?
A project that shows thoughtful reasoning may be more impressive than a dashboard containing dozens of technically complex visuals.
Public datasets can provide enough material for beginner projects without requiring access to confidential company information.
Data Visualisation Career Path in UK Organisations
There is not usually a single occupation called “data visualiser”.
Visualisation is a core capability within several careers.
A Data visualisation career path in UK organisations can begin through roles such as:
- data analyst;
- business intelligence analyst;
- reporting analyst;
- market research analyst;
- business analyst;
- performance analyst;
- insight analyst.
The current Skills England Data Visualisation Techniques Analyst Level 4 apprenticeship explicitly includes creating dashboards, reports, graphs and infographics and selecting appropriate tools.
This makes apprenticeships one possible work-based route into analytical careers.
University routes are also common, particularly through subjects such as statistics, mathematics, economics, computer science, business analytics and data science.
However, employers may also value strong portfolios and practical technical ability.
Career Progression
A junior data analyst might begin with Data Visualisation Techniques cleaning, recurring reports and basic charts.
With experience, responsibilities can move towards more complex analysis, stakeholder engagement, automation and dashboard ownership.
Potential progression includes:
Junior Data Analyst → Data Analyst → Senior Data Analyst → Lead Analyst or Analytics Manager
Other pathways may move towards:
- business intelligence;
- data science;
- analytics engineering;
- data journalism;
- research;
- consultancy;
- data product management.
The National Careers Service also notes that experienced data analysts can move into management, consultancy, research or data-science work.
The exact route depends on whether you prefer technical analysis, communication, management or specialist domain knowledge.
Salary Expectations in the UK
Because visualisation is used across many occupations, there is no meaningful single “data visualisation salary”.
Current National Careers Service guidance gives approximately £24,000 to £50,000 as an indicative range for market research Data Visualisation Techniques analysts.
Other analytical roles can fall above or below that range depending on industry, location, technical requirements and seniority.
London financial-services analytics, for example, may have very different remuneration from an entry-level public-sector reporting position.
Treat national ranges as orientation rather than guaranteed earnings.
Common Data Visualisation Mistakes
One mistake is trying to show everything.
Good analysis involves deciding what matters.
Another is selecting chart types because they look sophisticated rather than because they support the comparison.
A third is ignoring accessibility until publication.
Visualisation should also never hide poor Data Visualisation Techniques quality. If a dataset contains important gaps, communicate that limitation.
Finally, do not mistake dashboard-building for analysis.
A dashboard can display 25 metrics beautifully while failing to answer a single useful business question.
Frequently Asked Questions
What are the most important Data Visualisation Techniques?
Start by choosing a chart that matches the comparison you need to show. Bar charts work well for categories, line charts for trends and scatter plots for relationships. Clear labels, sensible scales, limited clutter and meaningful context are equally important.
What skills do I need for data visualisation?
Important data visualisation skills include Data Visualisation Techniques cleaning, analysis, chart selection, communication, statistical understanding and familiarity with tools such as Excel, Power BI, Tableau, Python or R.
What are the best data visualisation tools?
The best data visualisation tools depend on the task. Excel is useful for everyday analysis, Power BI and Tableau support interactive business reporting, while Python and R provide extensive flexibility for reproducible analytical work.
What is the difference between data analysis and data visualisation?
Data analysis examines information to identify patterns, relationships and conclusions. Data visualisation represents data visually so those patterns or findings can be explored or communicated. Visualisation is therefore one part of a wider analytical process.
What makes a good dashboard?
A good dashboard serves a clearly identified user need, prioritises important measures, provides context and avoids unnecessary visual or interactive complexity. Regularly updated dashboards also require ongoing maintenance and data-quality controls.
Is Power BI enough to get a data analyst job?
Power BI can be a valuable skill, but analyst roles commonly require broader abilities such as Data Visualisation Techniques cleaning, analytical reasoning, SQL, stakeholder communication and understanding of data quality. Software proficiency alone does not establish full analytical competence.
Is Excel still useful for data visualisation?
Yes. Excel remains practical for many business analyses and supports a wide range of standard charts and PivotCharts. More specialised platforms become useful when requirements involve larger models, automation, interactive reporting or centralised distribution.
How can I practise data visualisation?
Use public datasets and create small projects around specific questions. Document your cleaning, analysis, chart choice and conclusions. Comparing your work with established ONS or government visualisation guidance can also help develop better design judgement.
Do I need a degree for a data visualisation career?
Not for every role. Degree routes are common, but England also has a Level 4 Data Visualisation Techniques Analyst apprenticeship, and some employers consider practical experience and technical competence. Requirements vary considerably between jobs.
Can a Data Visualisation Techniques course get me a job?
A course can help develop knowledge and provide structured practice, but it cannot guarantee employment. Employers normally consider practical analytical ability, software skills, communication and evidence of work through employment, projects or a portfolio.

Conclusion
Strong Data Visualisation Techniques make data easier to understand without making it less accurate. The objective is not to decorate numbers but to reveal the comparison, pattern or relationship that matters.
That requires more than knowing how to operate data visualization tools. Effective visualisation begins with a clear question, reliable Data Visualisation Techniques and appropriate data analysis. From there, chart choice, labels, scales, accessibility and context determine whether the audience can interpret the result correctly.
The same principle applies to Data Visualisation Techniques dashboards. Build one because users genuinely need regularly updated, interactive information, not simply because dashboards appear sophisticated.
For people considering a Data visualisation career path in UK organisations, the strongest foundation combines analytical reasoning, communication and practical technical skills. Excel, Power BI, Tableau, SQL, Python and R can all become valuable depending on the role, but the software will continue to change.
The lasting skill is knowing what the Data Visualisation Techniques means, what the audience needs to understand and how to connect the two clearly and honestly.